Temperature source
Choosing a source…
Two columns: a timestamp (ISO, epoch ms, or hours since casting) and temperature in °C. A header row is skipped.
In-place estimate
—
Temperature history
All probes in the selected regime.
Equivalent age accrued
Each probe writes its own clock.
Strength accrual
Read off the calibrated curve.
Strength at each instant comes from the hyperbolic curve at that probe's accumulated equivalent age, not from its current temperature.
How the sensors are embedded
The same probe, cast into a cube in the laboratory and into the pour on site.
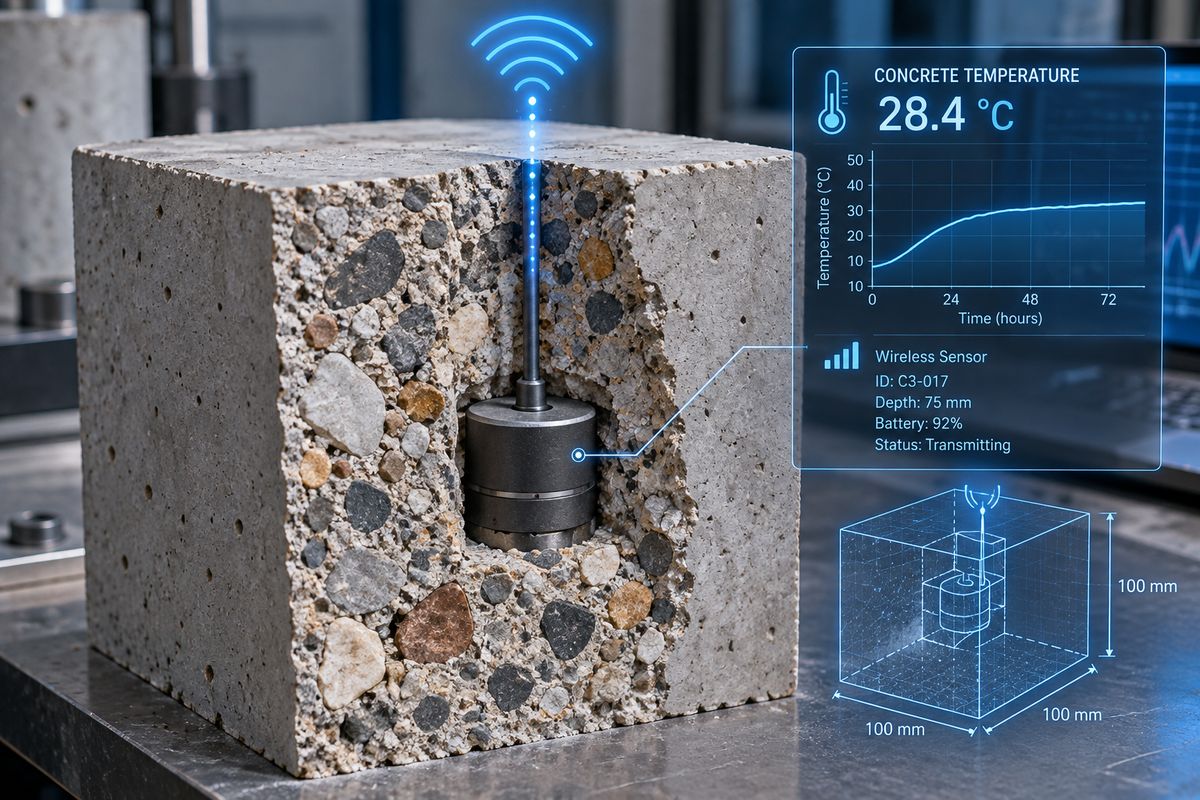

Illustrations of the method, not photographs of the Dedan Kimathi rig. A probe cast into the pour is consumed with it; on a real job that is the trade accepted in exchange for never having to cut a core.
Where the probes sit
Why four probes in one bath disagree.
Maturity functions
Both functions compress a temperature history into one number. Nurse–Saul sums degree-hours above a datum; the Arrhenius equivalent age weights each interval by how much faster or slower hydration runs at that temperature than at the reference.
Age-conversion factor
How fast the clock runs at each temperature.
Equivalent age development
28 chronological days under each regime.
Equivalent age at test ages
Chronological test age converted to equivalent age at the reference temperature.
Strength–maturity relationship
—
If the maturity function is right, the three curing regimes collapse onto one curve when strength is plotted against equivalent age. The spread that remains is the model error.
Strength vs chronological age
Measured cube strengths, three regimes.
Predicted vs measured
Parity plot against the calibrated curve.
Strength-gain constant k
Rate of strength gain per curing regime, all five mixes.
Mix and model constants
Everything downstream recomputes as you change these.
Apparent activation energy
Per sensor, from the Arrhenius plot of ln k against 1/T.
Sensor 05 (w/c 0.40) gave the steepest slope and supplied the adopted Q of 5286 K.
Arrhenius plot
ln k against 1/T for the selected mix.
Calibration set
Hyperbolic fit with a shared Su across the three regimes.
Measured compressive strength
150 mm cubes, mean of three, CEM I 42.5N.
Probe comparison
What each probe in the selected regime reports right now.
Export
Select and copy — file downloads are blocked inside the hosted viewer.